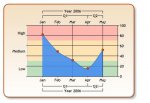
The Charting demo gives an example of color zones on the chart area, this case 3 rows of colors associated with different custom labels, High, Medium and Low. Unfortunately, they don't tell you how to implement this in code. I would like to break up my graph into 5 zones of color corresponding to the X-Axis, not the Y-axis, associated with their own custom labels. Can anyone enlighten me how to do this. The only thing I succeeded in doing was defining the custom labels with the correct X-axis range and coloring the custom label itself.
Thanks
